
Uptime Monitoring for Hasura GraphQL Engine with DataDog on GKE
Uptime monitoring is an important set up to determine availability and reliability of the servers in which your application is running. Hasura GraphQL Engine can be deployed as a Docker container and hence integrations with monitoring tools is a lot easier since most of them come with their built-in solution. By the end of this post, you will be able to set up monitoring alerts with DataDog on a Kubernetes cluster.
Set up Hasura GraphQL Engine on GKE
This documentation assumes that you have Hasura GraphQL Engine installed on Google Kubernetes Engine. Instructions for deployment is available here.
Install Datadog agent on Kubernetes
Head over to installation instructions of Datadog Agent on Kubernetes.
We will use Kubernetes DaemonSets to automatically deploy the Datadog Agent on all nodes.
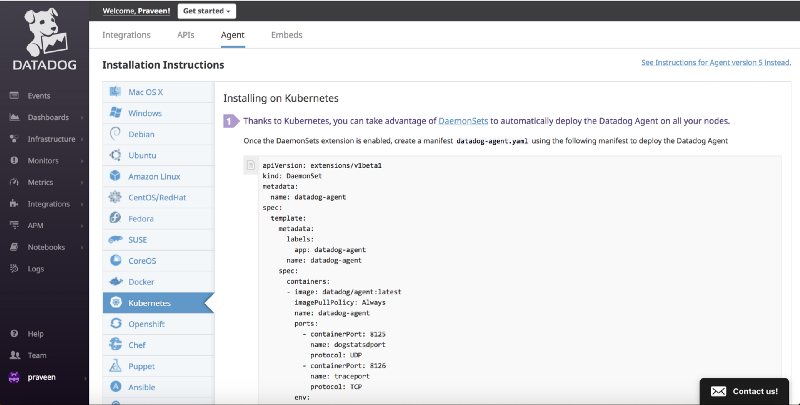
Once the DaemonSets extension is enabled, create a manifest datadog-agent.yaml using this manifest to deploy the Datadog Agent. The manifesDot also includes your Datadog account API key and hence it is recommended to use the same.
You’ll then be able to deploy the DaemonSet with the command
$ kubectl create -f datadog-agent.yamlCheck the status of the datadog agent pod using
$ kubectl get pods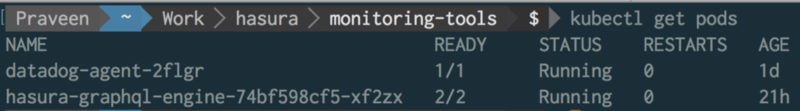
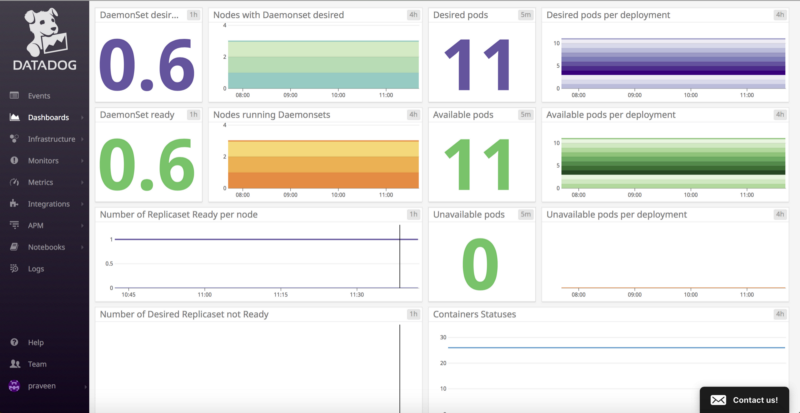
Once its up and running, you can go to your Datadog dashboard for Kubernetes to view metrics that are automatically collected by the agent.

By default, the Agent reports basic system metrics to Datadog, covering CPU, network, disk, and memory usage.
Fine grained metrics with kube-state-metrics
For more fine-grained metrics, you have to set up kube-state-metrics add-on to your cluster, which provides much more detailed metrics on the state of the cluster itself. Some of the metrics it collects are node status, node capacity (CPU and memory), number of desired/available/unavailable/updated replicas per deployment, pod status (e.g., waiting, running, ready), and so on.
Once you clone the kube-state-metrics repo, you just need to do the following:
An important note for GKE users is that GKE has strict role permissions that will prevent the kube-state-metrics roles and role bindings from being created. To work around this, you can give your GCP identity the cluster-admin role by running the following one-liner:
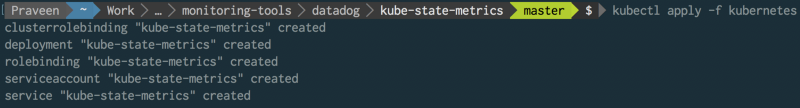
$ kubectl create clusterrolebinding cluster-admin-binding --clusterrole=cluster-admin --user=$(gcloud info | grep Account | cut -d '[' -f 2 | cut -d ']' -f 1)Once you get “cluster-admin-binding” created message, you can continue with the setup of this service by executing the following command:
$ kubectl apply -f kubernetesinside that repo as given in the README. The kubernetes folder contains service and deployment configs.
You can check the status of metrics deployment using
$ kubectl get deployment -n kube-systemand it will list a pod named metrics-server-v0.2.1 (at the time of writing, v0.2.1). Now head over to the Datadog dashboard to see more specific metrics from your Kubernetes cluster.
Once that is running, we can start creating Monitors in Datadog for alerts via Email.
Head over to DataDog Monitors and select Kubernetes or Docker integration to start creating monitoring alerts whenever a deployment or a pod is down.
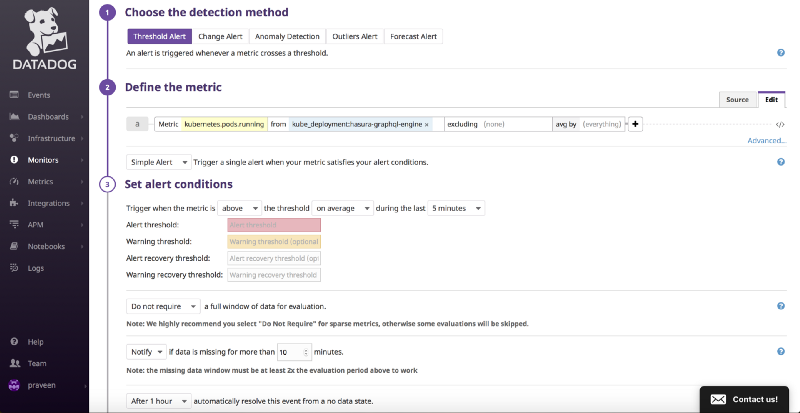
Define the metric to see if pods are running in the GraphQL Engine deployment by setting the threshold values for Alert (typically below 1), and setup notification via email in subsequent steps by templating the content of email.
You can create multiple monitors to track CPU and memory usage etc depending on the use case. To test if the alerts are working, let’s scale the deployment of graphql-engine to 0.
$ kubectl scale --replicas=0 deployment/hasura-graphql-engineNow depending on the metric setup, you will get an email alert because the pods are not running. Head over to manage monitors to see the status of each monitors.
This is a quick and effective way to setup uptime monitoring on a production kubernetes cluster for GraphQL Engine.